Explainer
What is data observability? The five pillars, and how it differs from testing
Data observability is continuous monitoring of data health across pipelines: freshness, volume, distribution, schema and lineage. How it differs from data quality tests, what to monitor first, and the tool options on Databricks, Snowflake and dbt.

Hemant Walchale
· 4 min read
Every data team has had the call: “the dashboard looks wrong.” Often the cause is mundane: a feed stopped, a file arrived half-empty, a column was renamed upstream. Data observability is the practice of catching those problems automatically, close to where they start, and knowing which reports and models they affect.
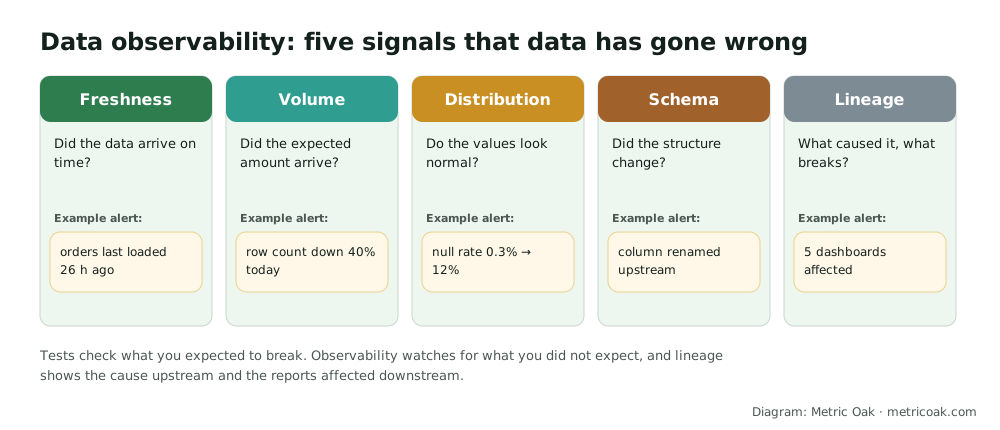
The five pillars
| Pillar | Question | Typical signal |
|---|---|---|
| Freshness | Did the data arrive on time? | Time since last update, compared with the expected schedule |
| Volume | Did the expected amount arrive? | Row counts or file sizes versus normal ranges |
| Distribution | Do the values look normal? | Null rates, distinct counts, ranges, averages drifting from baseline |
| Schema | Did the structure change? | Added, removed, renamed or retyped columns |
| Lineage | What caused it, and what does it affect? | Upstream sources and downstream tables, dashboards and models |
Observability vs testing
- Tests encode what you already know must be true: uniqueness, not-null, accepted values, referential integrity. They are cheap, explicit and belong in every pipeline (for example dbt tests or pipeline expectations).
- Observability watches for what you did not think to test. Monitors learn the normal pattern of freshness, volume and distributions and alert on deviations, then use lineage to trace the cause and the impact.
Tests catch known failures; observability catches the unknown ones and shortens the time to find and fix them. Mature teams use both.
What to monitor first
Monitoring everything creates noise. Start where errors are most expensive:
- Critical outputs: the tables behind executive dashboards, regulatory reports, finance figures and AI use cases.
- Freshness and volume on their key sources, which catch most incidents with few false alarms.
- Schema changes on inputs from systems you do not control (SaaS apps, partner files).
- Distribution checks on the few columns that drive decisions (amounts, statuses, IDs).
- Alert routing to the dataset owner, not a shared channel nobody reads.
Measure the result as fewer incidents found by users and a shorter time from failure to fix.
Tool options
- Built into platforms: Databricks offers data quality monitoring on Unity Catalog tables; Snowflake has data metric functions that measure freshness, nulls, duplicates and custom metrics on a schedule; Microsoft Fabric and Purview add data quality and monitoring features.
- dbt and pipeline frameworks: tests, source freshness checks and expectations within the pipelines themselves.
- Dedicated observability tools: Monte Carlo, Bigeye, Soda, Anomalo and others add cross-platform monitoring, anomaly detection, incident workflows and lineage.
Native features are often enough for one platform; dedicated tools earn their cost across several platforms or very large estates.
The short version
Data observability continuously watches freshness, volume, distribution and schema, and uses lineage to trace cause and impact, so data problems are caught before users find them. Pair it with explicit tests, start with the outputs that matter most, and route alerts to owners. Our data quality and governance service sets up testing, monitoring and ownership together.
Related: what is data lineage, data contracts for data leaders, what is data mesh, how to assess AI readiness and what is reverse ETL.
Sources
- Data quality monitoring, Databricks documentation
- Introduction to data quality and data metric functions, Snowflake documentation
- Add data tests to your DAG, dbt documentation
Further reading from other practitioners
Not sure where your own platform stands? Take the free 3-minute data platform scorecard. Unfamiliar terms are explained in the data engineering glossary.