How-to
How to set up Snowflake resource monitors: a step-by-step guide
How to set up Snowflake resource monitors to cap warehouse credit spend: account versus warehouse monitors, choosing quotas from metering history, NOTIFY and SUSPEND thresholds, SQL examples, finding unmonitored warehouses, and what monitors do not cover.

Hemant Walchale
· 4 min read
Snowflake bills by the second, which is great until a warehouse is sized up for one heavy job and nobody sizes it back down. Resource monitors put a ceiling on warehouse credits per day, week or month, and warn you well before you reach it. They take minutes to create; the work is choosing sensible quotas and making sure every warehouse is covered.
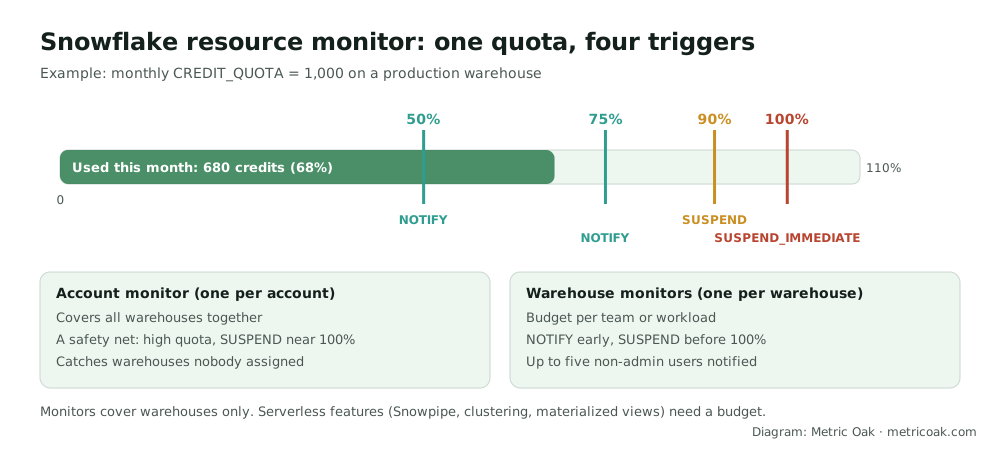
How resource monitors work
- Credit quota: credits allowed per interval. Usage resets at the start of each interval.
- Schedule: by default monthly from creation; you can set
FREQUENCY(daily, weekly, monthly, yearly or never) with aSTART_TIMESTAMP. - Actions at a percentage of the quota, which can go above 100%:
NOTIFY: alert only (up to five per monitor).SUSPEND: suspend assigned warehouses once running statements finish.SUSPEND_IMMEDIATE: suspend now and cancel running statements.
- Levels: one account monitor covering all warehouses, plus any number of warehouse monitors. Each warehouse can belong to only one warehouse monitor.
- Only ACCOUNTADMIN can create monitors, but it can grant
MONITORorMODIFYon a monitor to other roles.
Step 1: Pick quotas from real usage
Look at the last three months of credits per warehouse before choosing numbers:
SELECT warehouse_name,
       DATE_TRUNC('month', start_time) AS month,
       SUM(credits_used) AS credits
FROM snowflake.account_usage.warehouse_metering_history
WHERE start_time >= DATEADD(month, -3, CURRENT_DATE)
GROUP BY 1, 2
ORDER BY 1, 2;
Set each warehouse’s quota at its normal monthly usage plus headroom (for example 20 to 30%), so the monitor flags real anomalies and not normal growth.
Step 2: Create a warehouse monitor
USE ROLE ACCOUNTADMIN;

CREATE OR REPLACE RESOURCE MONITOR rm_prod_etl
  WITH CREDIT_QUOTA = 1000
       FREQUENCY = MONTHLY
       START_TIMESTAMP = IMMEDIATELY
  TRIGGERS ON 50 PERCENT DO NOTIFY
           ON 75 PERCENT DO NOTIFY
           ON 90 PERCENT DO SUSPEND
           ON 100 PERCENT DO SUSPEND_IMMEDIATE;

ALTER WAREHOUSE wh_prod_etl SET RESOURCE_MONITOR = rm_prod_etl;
A monitor does nothing until it is assigned. For production pipelines that must finish, you may prefer NOTIFY only, plus an on-call process, over automatic suspension. Decide that with the pipeline owner, not after the first outage.
Step 3: Add an account-level safety net
CREATE OR REPLACE RESOURCE MONITOR rm_account
  WITH CREDIT_QUOTA = 5000
  TRIGGERS ON 80 PERCENT DO NOTIFY
           ON 100 PERCENT DO NOTIFY
           ON 110 PERCENT DO SUSPEND;

ALTER ACCOUNT SET RESOURCE_MONITOR = rm_account;
Set it above the sum of normal usage. Its job is to catch the warehouse nobody assigned and the month something went badly wrong.
Step 4: Make sure notifications arrive
Notifications are off until enabled. Account administrators need notifications turned on and a verified email address. Non-admin users can receive email for warehouse monitors only (up to five users per monitor), each with a verified email.
Step 5: Find warehouses without a monitor
SHOW WAREHOUSES;
SELECT "name", "size"
FROM TABLE(RESULT_SCAN(LAST_QUERY_ID()))
WHERE "resource_monitor" = 'null';
Run this regularly, or as a scheduled check, because new warehouses do not get a monitor automatically.
Step 6: Cover what monitors cannot
Resource monitors only see warehouses. Use budgets for serverless features (Snowpipe, automatic clustering, materialized views, search optimization) and to alert on spend across groups of objects. And remember a monitor caps spend; it does not make queries cheaper. Pair it with warehouse right-sizing, auto-suspend settings and query tuning.
The short version
Size quotas from three months of metering history, create a monitor per important warehouse with NOTIFY at 50 and 75% and suspension near 90 to 100%, add an account-level safety net, turn on notifications, check regularly for unmonitored warehouses, and use budgets for serverless costs. Our cloud data cost optimization service sets these up alongside right-sizing.
Related: Snowflake pricing explained, where data platform costs hide, how to set up Databricks compute policies and how to size a Microsoft Fabric capacity.
Sources
- Working with resource monitors, Snowflake documentation
- CREATE RESOURCE MONITOR, Snowflake SQL reference
- WAREHOUSE_METERING_HISTORY view, Snowflake documentation
Further reading from other practitioners
Not sure where your own platform stands? Take the free 3-minute data platform scorecard, or see how we work on Snowflake. Unfamiliar terms are explained in the data engineering glossary.