How-to
How to size a Microsoft Fabric capacity: a step-by-step guide
How to choose the right Microsoft Fabric F SKU: what capacity units mean, measuring on a trial with the Capacity Metrics app, the SKU Estimator, smoothing and the four throttling stages, the F64 licensing threshold, and when to scale, split or pause.

Hemant Walchale
· 5 min read
A Fabric capacity is a single pool of compute shared by every workload in its workspaces: Power BI, Spark, warehouses, pipelines and real-time analytics. Size it too small and users hit throttling; too large and you pay for idle capacity units around the clock. The good news is that F SKUs can be scaled, paused and measured, so sizing is an iterative process rather than a one-off bet.
Understand what you are buying
Each F SKU provides a number of capacity units (CUs) equal to its name: F2 has 2 CUs, F64 has 64, up to F2048 and beyond. Fabric measures use in 30-second timepoints, so an F64 can use 1,920 CU-seconds per timepoint.
Two mechanisms make a capacity feel bigger than its CUs:
- Bursting: an operation can use more compute than the SKU provides, so it finishes fast.
- Smoothing: that usage is then spread over future timepoints: at least 5 minutes for interactive operations (up to 64 minutes for heavy ones), and 24 hours for background operations such as refreshes, pipelines and most warehouse work.
So you are sizing for smoothed usage, not for the raw peak of any single job.
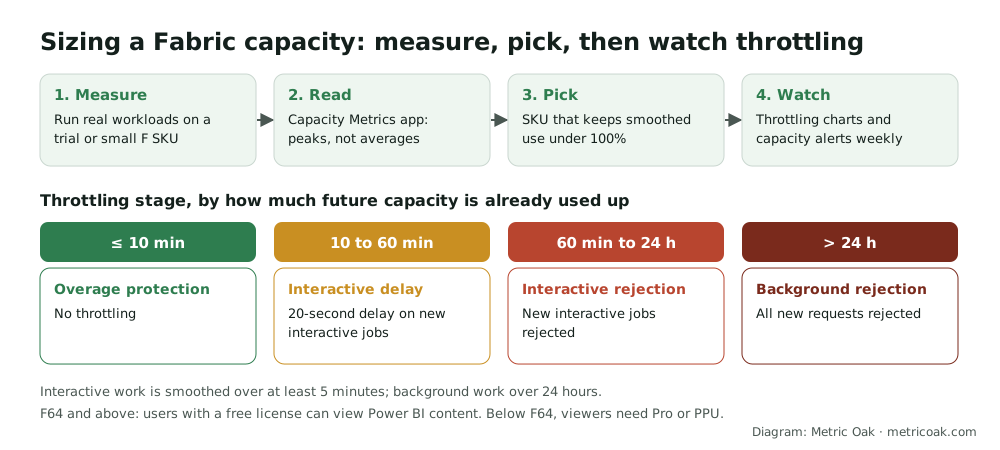
Step 1: Get a first estimate
Use the Fabric SKU Estimator (preview) with your data volumes, workloads and user counts. Treat the result as a starting point, not a commitment.
Step 2: Measure real workloads
Run representative work, including your heaviest refreshes and busiest report hours, on a trial capacity (60 days, equivalent to F64) or a pay-as-you-go F SKU you can resize. Two to four weeks covering month-end is better than one quiet week.
Step 3: Read the Capacity Metrics app
Install the Microsoft Fabric Capacity Metrics app and check:
- Utilization over time, and drill into the highest timepoints to see which interactive and background operations drive them.
- The Throttling charts, which show when smoothed use crossed the 10-minute, 60-minute or 24-hour limits. Utilization above 100% does not by itself mean throttling.
- The Overages tab, for carry-forward and burndown.
Optimise the worst offenders before buying more capacity: an inefficient semantic model or notebook often costs more than the SKU step it would push you into.
Step 4: Pick the SKU
Choose the SKU that keeps smoothed utilization comfortably under 100% at your busiest times, then check two other factors:
- Licensing: on F64 and above, free-licensed users with a viewer role can view Power BI content. Below F64 every viewer needs Pro or PPU. Price both options if you have many report viewers.
- Isolation: one capacity’s overload throttles everything on it. Separating production reporting from data engineering and ad-hoc work onto different capacities often beats one larger capacity.
Step 5: Know the throttling stages
| Future capacity already used | Stage | Effect |
|---|---|---|
| Up to 10 minutes | Overage protection | No throttling |
| 10 to 60 minutes | Interactive delay | New interactive operations delayed 20 seconds |
| 60 minutes to 24 hours | Interactive rejection | New interactive operations rejected; background continues |
| Over 24 hours | Background rejection | All new requests rejected |
Operations already running are allowed to finish. Users see errors such as CapacityLimitExceeded when requests are rejected.
Step 6: Keep it right-sized
- Alerts: set capacity threshold alerts so you hear about overload before users do.
- Scale up or down as patterns change; F SKUs bill per second with a one-minute minimum. Scaling across the F256 and F512 boundary can be slower.
- Pause non-production capacities outside working hours. Pausing bills any accumulated future usage and makes content on that capacity unavailable.
- Reserve the baseline you are sure of for a discount, and keep peaks on pay-as-you-go or scheduled scaling.
- Capacity overage billing can stop throttling but is charged at three times the normal rate; treat it as an emergency valve, not a plan.
The short version
Estimate with the SKU Estimator, measure real workloads on a trial for a few weeks, size for smoothed peaks in the Capacity Metrics app, and weigh the F64 licensing threshold and workload isolation before buying. Then alert on throttling, pause non-production capacity, and reserve only the steady baseline. Our cloud data cost optimization service runs this sizing as part of Fabric cost reviews.
Related: Microsoft Fabric pricing explained, hidden costs on Databricks, Snowflake and Fabric, how to set up Snowflake resource monitors and Databricks vs Microsoft Fabric.
Sources
- Plan your capacity size, Microsoft Learn
- Understand capacity throttling and smoothing, Microsoft Learn
- Microsoft Fabric licenses and capacity, Microsoft Learn
Further reading from other practitioners
Not sure where your own platform stands? Take the free 3-minute data platform scorecard. Unfamiliar terms are explained in the data engineering glossary.