Cost
Hidden costs on Databricks, Snowflake and Microsoft Fabric (and how to fix each)
Fifteen costs that grow data platform bills without anyone noticing: five each on Databricks, Snowflake and Microsoft Fabric, why they happen and the fix for each.

Hemant Walchale
· 4 min read
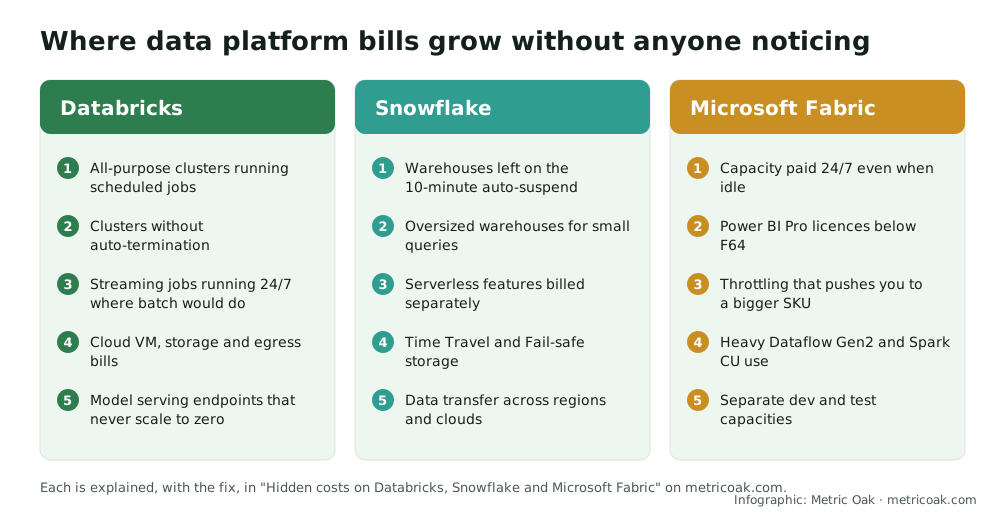
Data platform bills rarely jump because of one bad decision. They creep, through defaults nobody changed, features switched on once and forgotten, and charges that appear on a different invoice. Here are fifteen of the most common, five per platform, each with its fix.
Databricks
- All-purpose clusters running scheduled jobs. Interactive compute costs about three to four times as much per DBU as jobs compute. Fix: run every scheduled workload on job compute or serverless jobs, and enforce it with cluster policies.
- Clusters without auto-termination. An interactive cluster left on overnight bills for every idle hour, plus the cloud VMs. Fix: cluster policies with auto-termination (for example 30 minutes) for every interactive cluster.
- Streaming jobs running 24/7 where batch would do. A continuously running stream for data that is only read each morning pays for 24 hours of compute. Fix: use scheduled or triggered runs (for example “available now” triggers) unless the business needs minutes-fresh data.
- Cloud VM, storage and egress bills. On classic compute, the VMs, object storage and data transfer appear on your cloud invoice, not Databricks’, so they are often missed in cost reviews. Fix: review both invoices together, tag resources consistently, and run
VACUUMto remove old file versions you no longer need. - Model serving endpoints that never scale to zero. An endpoint provisioned for peak traffic bills while idle. Fix: enable scale-to-zero for non-critical endpoints and right-size the rest.
See Databricks pricing explained for how the bill is built.
Snowflake
- Warehouses left on the 10-minute auto-suspend. The default
AUTO_SUSPENDis 600 seconds, so every burst of work is followed by up to 10 minutes of paid idling. Fix: lower it (often to 60 seconds) for warehouses with occasional queries, after checking the effect on caching. - Oversized warehouses for small queries. Each size step doubles the cost per hour; many dashboards run perfectly on Small. Fix: test one size down for each warehouse, compare query times, and separate heavy and light workloads.
- Serverless features billed separately. Automatic clustering, search optimization, materialized views, Snowpipe and serverless tasks consume credits outside warehouse budgets. Fix: review serverless credit usage monthly and switch off features that don’t pay for themselves.
- Time Travel and Fail-safe storage. Large, frequently updated tables with long Time Travel retention keep many historical versions. Fix: set retention per table to what recovery actually needs, and use transient tables for staging data.
- Data transfer across regions and clouds. Replicating or unloading data to another region or cloud incurs transfer charges. Fix: keep data, compute and consumers in one region where possible, and replicate only what must be replicated.
See Snowflake pricing explained for the billing rules.
Microsoft Fabric
- Capacity paid 24/7 even when idle. A pay-as-you-go capacity bills every hour it runs, used or not. Fix: pause development and test capacities outside working hours, and reserve only the capacity that is busy all day.
- Power BI Pro licences below F64. On capacities smaller than F64, every report viewer needs a paid licence. Fix: compare a smaller SKU plus viewer licences with a reserved F64; for many viewers, F64 is cheaper.
- Throttling that pushes you to a bigger SKU. Sustained overuse is throttled rather than billed, and the usual reaction is upsizing. Fix: use the Capacity Metrics app to find the few items consuming most CUs and optimize them before buying a bigger capacity.
- Heavy Dataflow Gen2 and Spark CU use. Low-code transformations and oversized Spark sessions can consume a large share of the capacity. Fix: move heavy transformations to Warehouse SQL or tuned notebooks, and right-size Spark pools.
- Separate development and test capacities. Each environment on its own always-on capacity multiplies the bill. Fix: share a small development capacity, pause it when idle, and use deployment pipelines between workspaces.
See Microsoft Fabric pricing explained for SKUs, reservations and the F64 threshold.
Where to start
Attribute spend before cutting it: Databricks billing system tables and tags, Snowflake account usage views and query tags, and the Fabric Capacity Metrics app. Fix idle compute first, then sizing, then features nobody uses. Our 12 places costs hide goes further into workload-level waste.
Model the effect of changes with the cost calculator. Our cloud data cost optimization service does this attribution and clean-up as a fixed-scope engagement.
Sources
- Databricks pricing
- Snowflake documentation: understanding compute cost and warehouse considerations
- Microsoft Fabric pricing and Fabric capacity and OneLake consumption
Further reading from other practitioners
- Hidden costs of Microsoft Fabric, Aimpoint Digital
- The 7 hidden costs of Microsoft Fabric: a practitioner’s guide, TimeXtender
- Maximizing your Databricks investment: how to spot invisible drift and optimize spend, XTIVIA
- Databricks cost optimization, LatentView Analytics
Not sure where your own platform stands? Take the free 3-minute data platform scorecard, or see how we work on Databricks. Unfamiliar terms are explained in the data engineering glossary.