Guide
FinOps for data platforms: a practical guide for Databricks, Snowflake and Microsoft Fabric
How to apply FinOps to data platforms: getting cost data out of Databricks, Snowflake and Fabric, tagging and allocation, showback versus chargeback, unit costs, the optimizations that matter, guardrails, KPIs and a 90-day plan.

Hemant Walchale
· 8 min read
Data platforms have become one of the largest and fastest-growing lines on many cloud bills, and one of the least understood. Spend is created by thousands of queries and pipelines, billed in platform-specific units, on compute that several teams share. FinOps gives a structure for bringing that under control without slowing teams down. This guide applies it specifically to Databricks, Snowflake and Microsoft Fabric.
FinOps in one paragraph
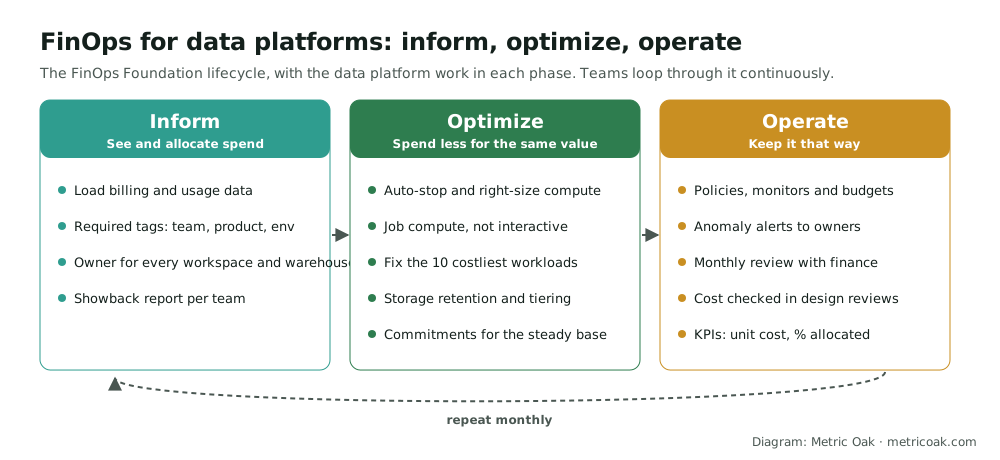
The FinOps Foundation defines a lifecycle of three phases: Inform (visibility and allocation), Optimize (reducing waste and improving efficiency) and Operate (governance, KPIs and continuous improvement). Its principles include that teams collaborate, everyone takes ownership of their usage, business value drives technology decisions, and FinOps data is accessible, timely and accurate. Teams loop through the phases continuously rather than completing them once.
Why data platforms need their own approach
- Own billing units. Databricks bills DBUs (plus cloud infrastructure for classic compute), Snowflake bills credits plus storage and transfer, Fabric bills capacity units by SKU. Cloud cost tools often see only a single line for each.
- Spend is created by code. A badly written query or a pipeline that reprocesses everything daily costs more than any server decision. Engineers and analysts, not procurement, create most of the bill.
- Shared compute. One SQL warehouse or Fabric capacity serves many teams, so cost per team needs query-level or tag-level allocation.
- Hidden lines. Serverless features, storage, data transfer and idle time are easy to miss. See where data platform costs hide.
Inform: get the data and allocate it
Where the cost data lives
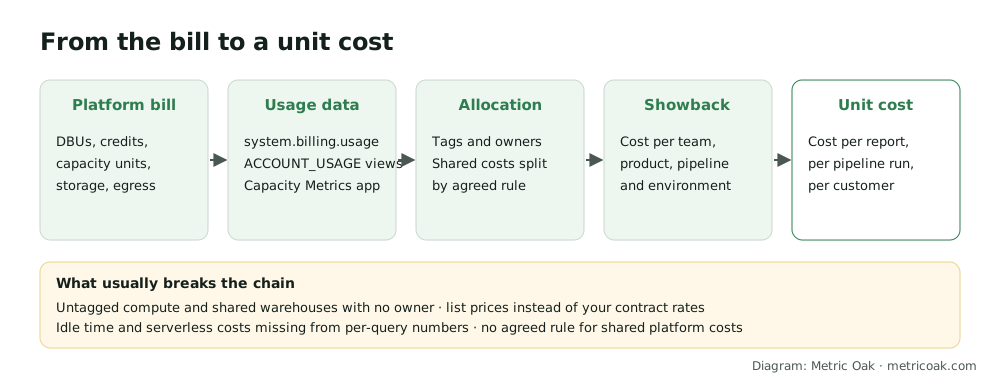
| Platform | Main sources | Watch out for |
|---|---|---|
| Databricks | system.billing.usage (usage with tags and job, warehouse and cluster IDs) joined to system.billing.list_prices |
List prices only: apply your negotiated discount. Classic compute also has cloud VM costs on your cloud bill |
| Snowflake | ORGANIZATION_USAGE.USAGE_IN_CURRENCY_DAILY for cost in currency; ACCOUNT_USAGE views such as WAREHOUSE_METERING_HISTORY, QUERY_ATTRIBUTION_HISTORY and TAG_REFERENCES |
Per-query attribution excludes idle time, storage, cloud services and serverless features |
| Microsoft Fabric | Azure Cost Management for the capacity bill; the Fabric Capacity Metrics app for usage by workspace, item and operation | The bill is per capacity; splitting it by team means allocating capacity unit usage |
Bring these into one place, ideally a small cost model in your own platform. The FOCUS specification from the FinOps Foundation gives a common schema for cost and usage data across providers, and is worth adopting if you combine several platforms or feed a central FinOps tool.
Tag and assign owners
- Required tags on every cluster, job, warehouse and capacity: at minimum
team(or cost centre),productandenvironment. Enforce them with Databricks compute policies, Snowflake object tags on warehouses and users, and one Fabric capacity or workspace group per cost owner where practical. - Tag in the tooling, not by hand: set tags in orchestration, dbt profiles and infrastructure-as-code so every job carries them automatically. On Snowflake, use query tags when one shared application runs queries for several teams.
- An owner for every workspace, warehouse and capacity. Untagged or ownerless spend should be a reported number that goes down each month.
Example: Databricks spend this month by cost centre, at list price:
SELECT u.custom_tags['cost_center'] AS cost_center,
       SUM(u.usage_quantity * p.pricing.effective_list.default) AS list_cost
FROM system.billing.usage u
JOIN system.billing.list_prices p
  ON u.sku_name = p.sku_name
 AND u.cloud = p.cloud
 AND u.usage_end_time >= p.price_start_time
 AND (p.price_end_time IS NULL OR u.usage_end_time < p.price_end_time)
WHERE u.usage_date >= DATE_TRUNC('month', CURRENT_DATE())
GROUP BY 1
ORDER BY 2 DESC;
Snowflake credits this month by the cost_center tag on warehouses:
SELECT tr.tag_value AS cost_center,
       SUM(wmh.credits_used) AS credits
FROM snowflake.account_usage.warehouse_metering_history wmh
LEFT JOIN snowflake.account_usage.tag_references tr
  ON wmh.warehouse_id = tr.object_id
 AND tr.domain = 'WAREHOUSE'
 AND tr.tag_name = 'COST_CENTER'
WHERE wmh.start_time >= DATE_TRUNC('month', CURRENT_DATE)
GROUP BY 1
ORDER BY 2 DESC;
Showback, then chargeback
- Showback first: a monthly report of each team’s spend, including unallocated and shared costs, with no money moving.
- Agree the shared-cost rule: platform overhead, shared warehouses and capacity are split proportionally to measured usage, evenly, or held centrally. Pick one rule and keep it stable.
- Chargeback when trusted: once teams accept the numbers, usually after several months, budgets can move to the teams that create the spend.
Unit costs
Total spend going up is fine if the business is growing faster. Track a few unit costs that connect spend to value: cost per pipeline run, per dashboard view, per thousand events processed, or per customer served. These turn “the bill went up” into a question with an answer.
Optimize: the changes that matter most
Prioritise by size, not by how interesting the fix is. On most data platforms the biggest wins are:
- Stop paying for idle compute: auto-termination and auto-suspend on every cluster and warehouse; pause non-production Fabric capacities out of hours.
- Right-size: smaller clusters, warehouses or capacity SKUs where utilization is low. See how to size a Microsoft Fabric capacity.
- Use the right compute type: scheduled work on Databricks job compute rather than all-purpose clusters; isolated warehouses for heavy ETL rather than one oversized shared warehouse.
- Fix the top 10 workloads: a short list of pipelines and queries usually drives a large share of spend. Incremental processing instead of full reloads (change data capture), partition pruning and clustering, and fewer refreshes than the business actually needs.
- Storage hygiene: retention for time travel and old snapshots, cleanup of unused tables and files, lifecycle tiering for raw data.
- Rate optimization: once usage is stable, use commitments (Databricks committed-use contracts, Snowflake capacity contracts, Fabric reservations) for the steady baseline only.
For platform-specific detail, see Databricks pricing explained, Snowflake pricing explained, Microsoft Fabric pricing explained and hidden costs on Databricks, Snowflake and Fabric.
Operate: make savings stick
- Guardrails: compute policies on Databricks, resource monitors and budgets on Snowflake, capacity alerts on Fabric.
- Anomaly alerts sent to the owning team when daily spend for a workspace, warehouse or tag jumps above its normal range.
- A monthly review with engineering and finance: spend by team, top movers, unit costs, forecast versus budget, and agreed actions with owners.
- Cost in design: new pipelines and products get a cost estimate in design review, and a check after launch.
- KPIs: percentage of spend allocated, idle compute cost, unit costs, forecast accuracy, and savings delivered against plan.
A 90-day plan
| Days | Focus | Outcome |
|---|---|---|
| 1 to 30 | Inform | Cost data loaded from each platform, tagging standard agreed and enforced on new compute, first showback report |
| 31 to 60 | Optimize | Idle compute eliminated, top 10 workloads reviewed and fixed, right-sizing done, savings tracked |
| 61 to 90 | Operate | Guardrails and anomaly alerts live, monthly review running, unit costs and KPIs reported, commitment decision made |
The short version
FinOps on data platforms starts with getting cost data out of each platform and allocating it to owners through enforced tags. Then optimize where the money actually goes (idle compute, right-sizing, the top workloads, storage and rates) and keep it there with guardrails, anomaly alerts, a monthly review and unit-cost KPIs. Our cloud data cost optimization service runs this end to end, and our data platform assessment includes a cost review with a priced roadmap.
Related: where data platform costs hide, hidden costs on Databricks, Snowflake and Fabric, how to set up Databricks compute policies and how to set up Snowflake resource monitors.
Sources
- FinOps Framework overview, Microsoft Learn (summarising the FinOps Foundation framework: principles, lifecycle and capabilities)
- FinOps Framework and FOCUS specification, FinOps Foundation
- Billable usage system table and pricing system table, Databricks documentation
- Attributing cost and exploring overall cost, Snowflake documentation
- Understand capacity throttling and smoothing, Microsoft Learn
Further reading from other practitioners
- FinOps in Databricks: a CTO’s guide to cloud cost strategy, Aimpoint Digital
- FinOps for Snowflake, XenonStack
- Showback vs chargeback for Snowflake, Databricks and BigQuery, Revefi
- How to manage Databricks and Snowflake costs, Flexera
- What is FinOps for data cloud platforms?, Keebo
Not sure where your own platform stands? Take the free 3-minute data platform scorecard, or see how we work on Databricks. Unfamiliar terms are explained in the data engineering glossary.